

Wall Street Is Unusually Optimistic About Third-Quarter Earnings. Here's Why in 5 Charts.-By Elijah Nicholson-Messmer,BARRON's


Analysts are painting a rosy picture of third-quarter results ahead of the earnings season, which unofficially kicks off with the big-bank reports this week.
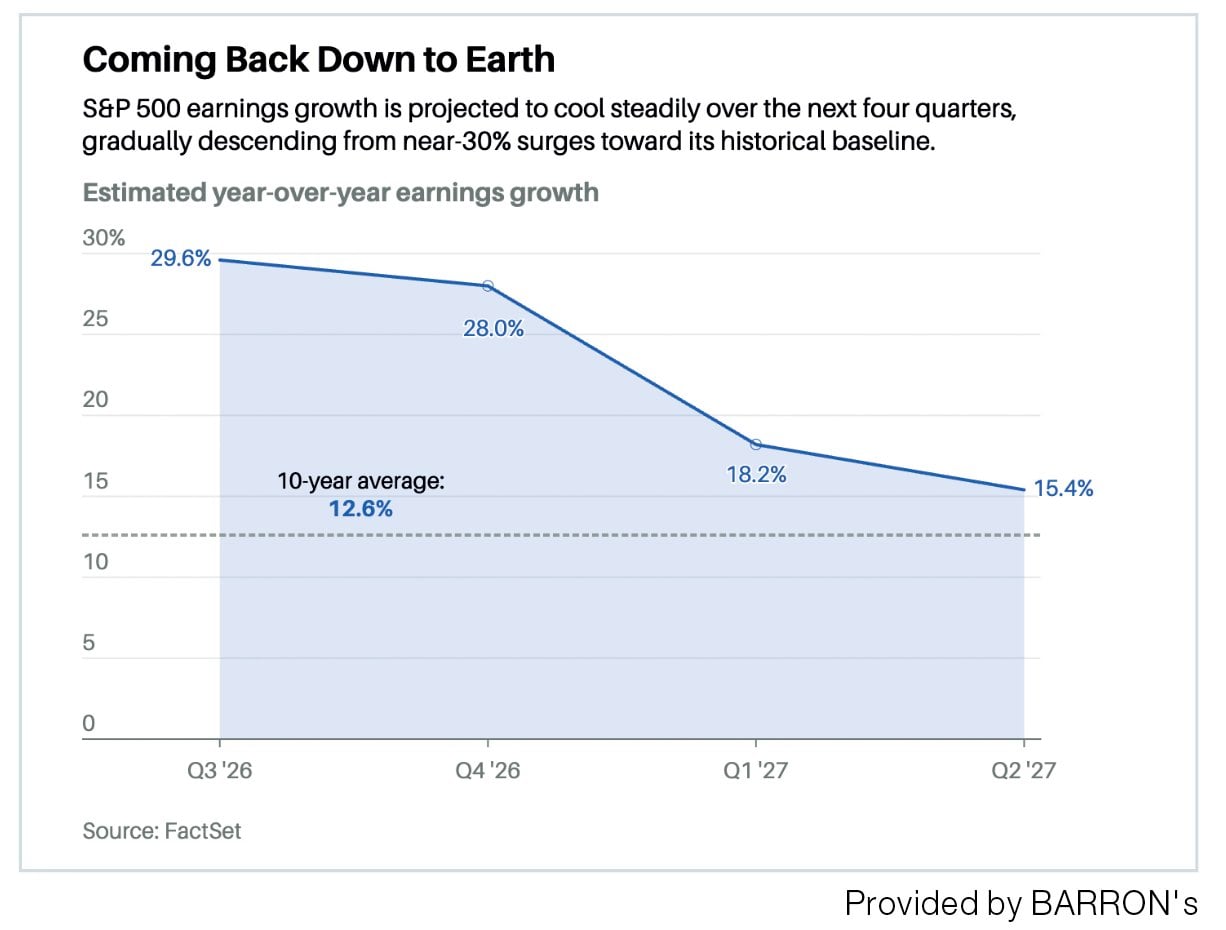
The S&P 500’s estimated third-quarter earnings growth of 29.6% would mark its third straight quarter of growth above 25%. It’s an impressive streak given that the index’s earnings have grown at an average quarterly clip of 12.6% over the last decade, according to FactSet.
The third-quarter growth is likely to head even higher, once companies start reporting, given the typical history of earnings beats from Corporate America.
Already, a historic number of S&P 500 companies have forecast earnings for the quarter above what analysts had expected. Wall Street, in other words, is full of good vibes.
Here are five charts that show how this corporate confidence is breaking out across the index—and where it might be heading.
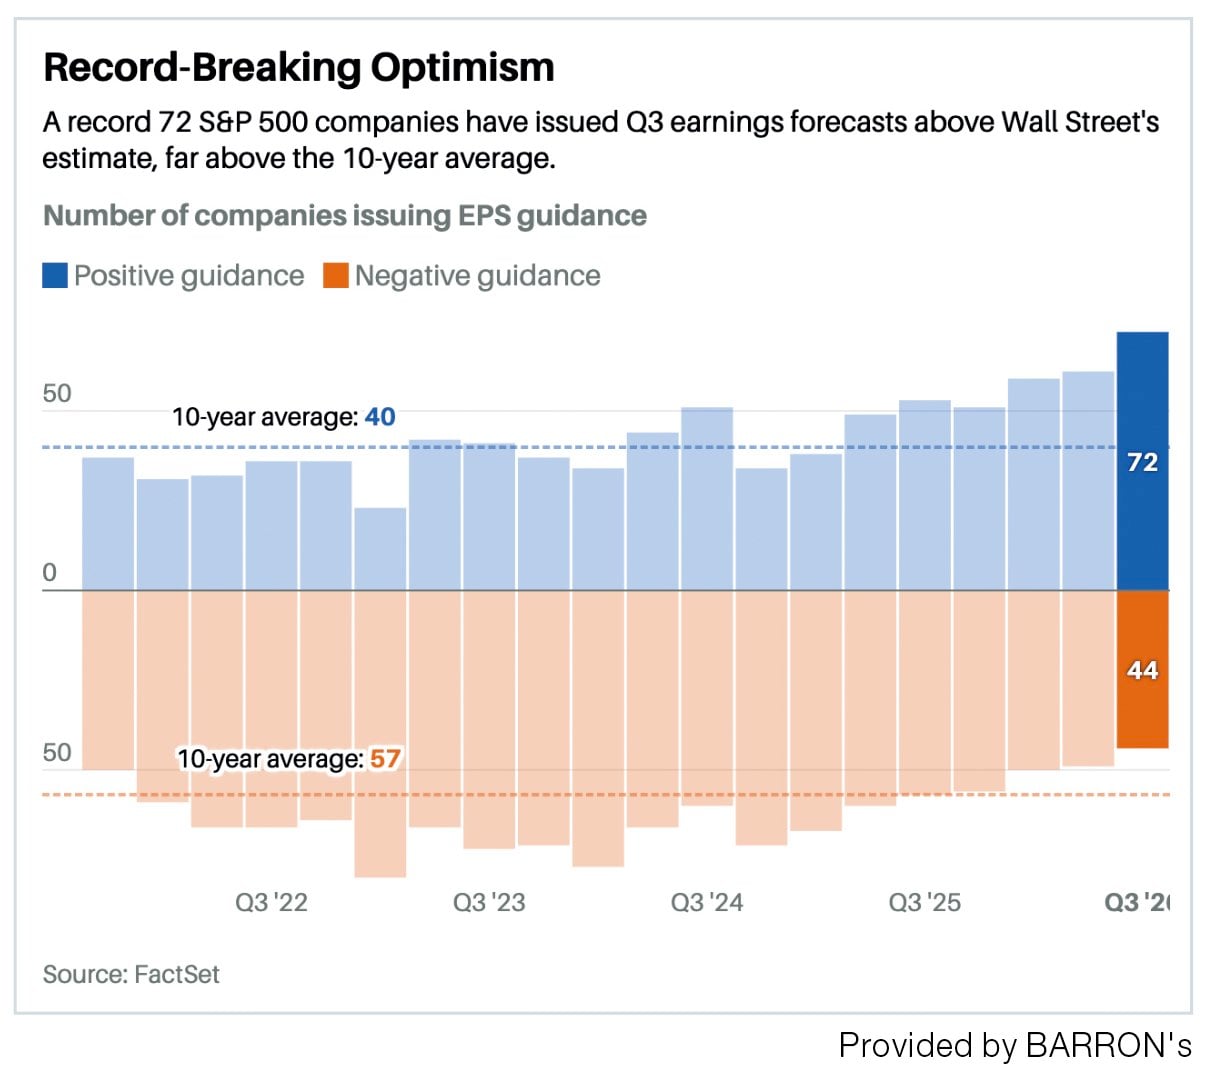
The 72 companies offering upbeat forecasts is unprecedented, according to FactSet.
“This quarter marks the highest number of S&P 500 companies issuing positive EPS guidance for a quarter since FactSet began tracking this metric in 2006,” FactSet Senior Earnings Analyst John Butters wrote in a recent note.
On the other side of things, just 44 companies have offered downbeat guidance—well below the 10-year average of 57.
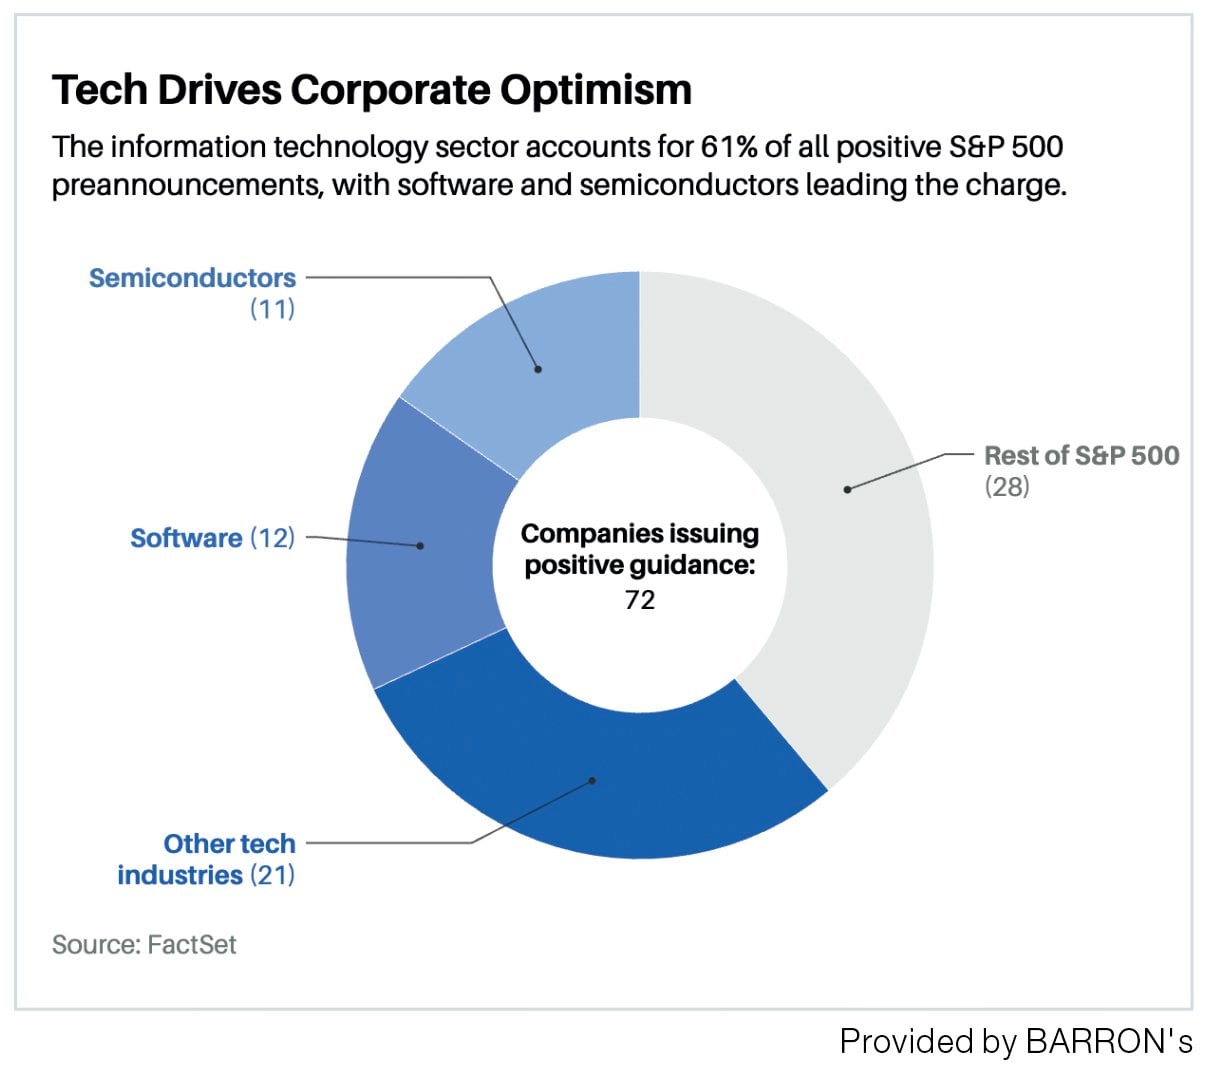
Stocks in the information technology sector have dominated the strong guidance. The sector accounts for 44 of the 72 total positive preannouncements.
Within tech, software and semiconductor companies are leading the charge. Fueled by seemingly insatiable demand for artificial intelligence, the semiconductor industry alone is projected to grow Q3 earnings by 130% year-over-year.
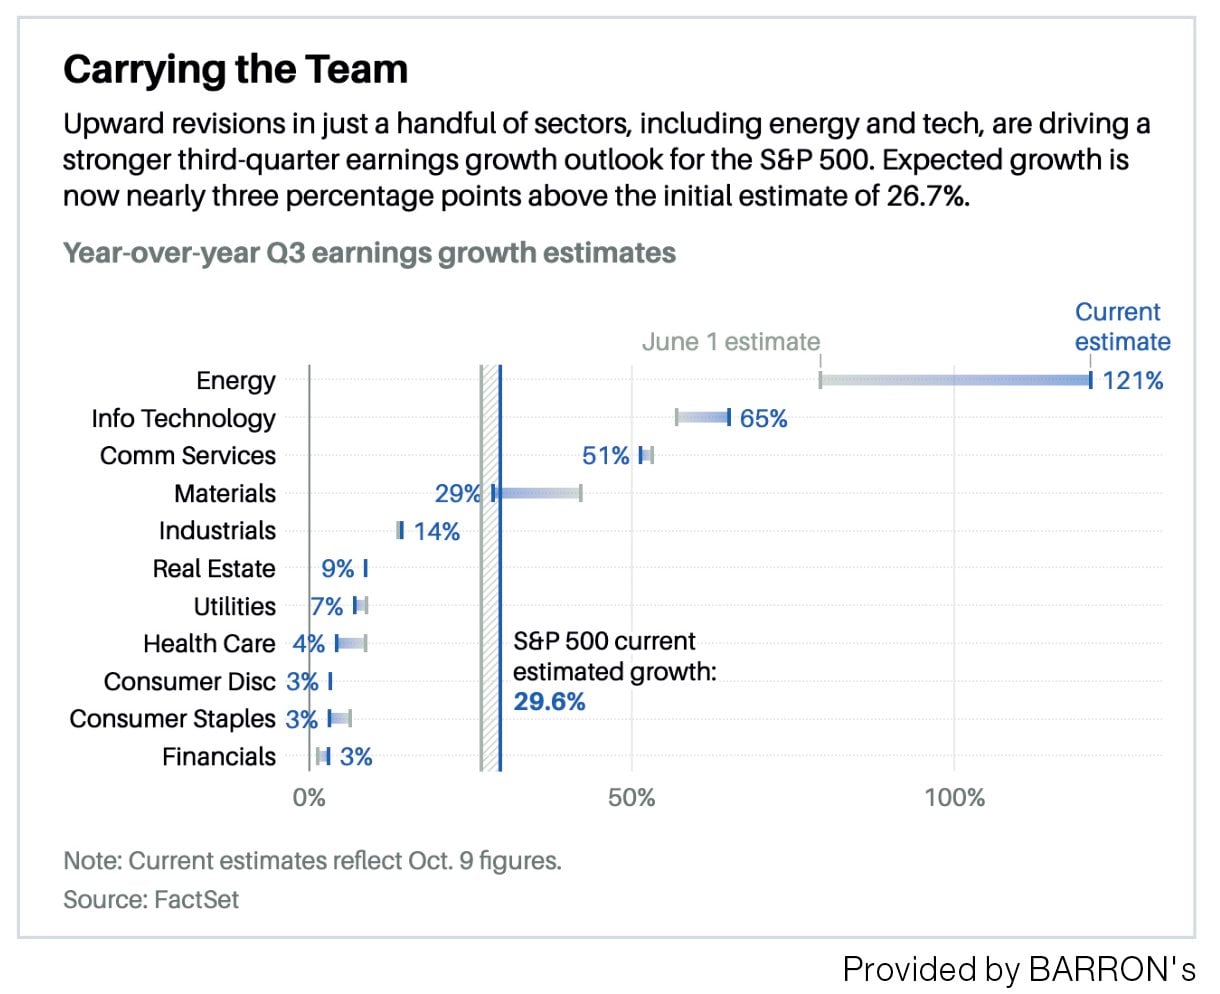
The strong outlooks from companies are showing up in Wall Street’s evolving view of the quarter. While analysts now expect third-quarter earnings growth of 29.6% from S&P 500 companies, on June 1 that forecast was nearly three percentage points lower.
Interestingly, the biggest change is being driven by the energy sector, where Wall Street’s projected year-over-year growth surged to 121% (up from 79% in June) following a jump in crude oil prices. Tech growth estimates rose to 65%, up eight percentage points from initial estimates at the start of the quarter.
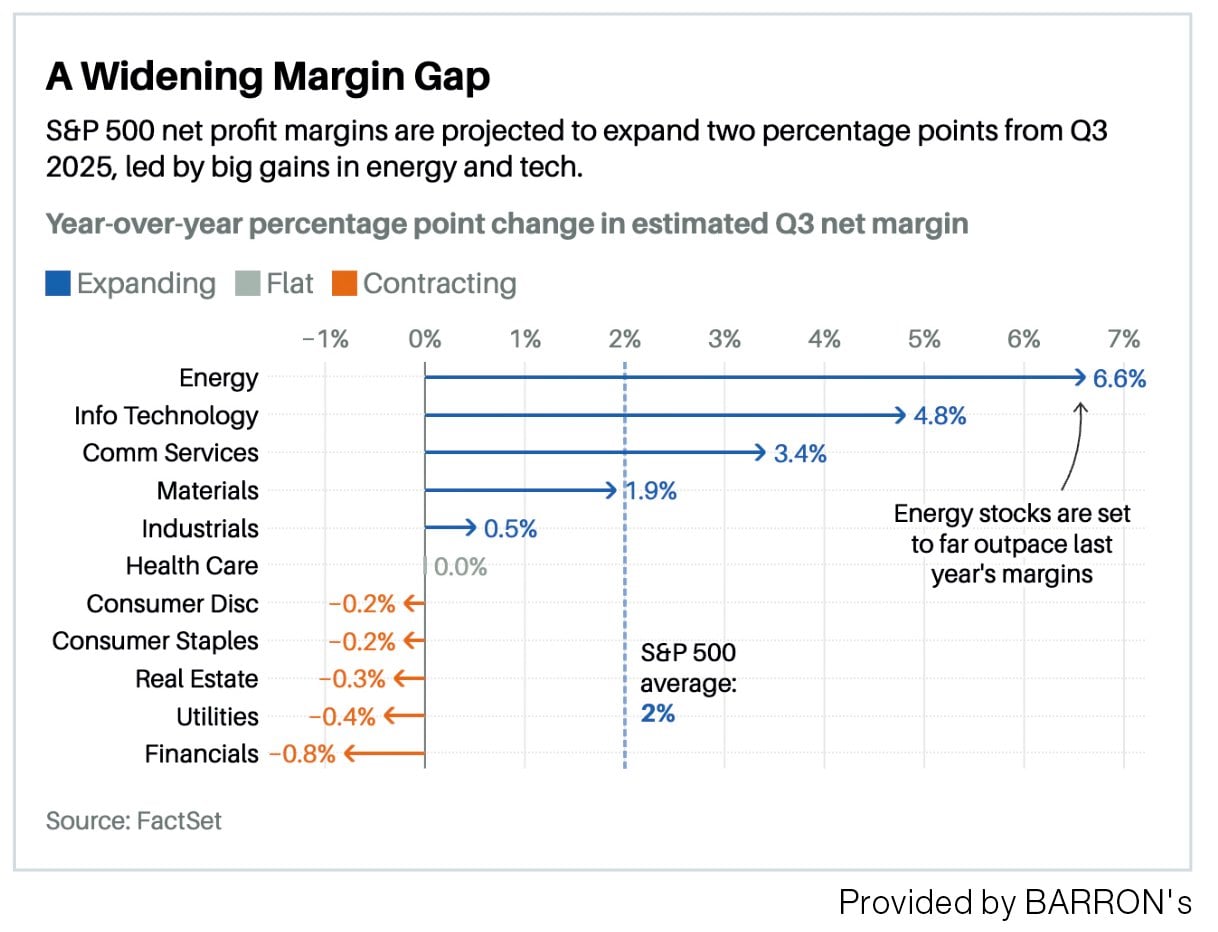
Much of the S&P 500 seems to be finding ways to offset rising costs, resulting in a higher net margin. In fact, S&P 500 net profit margins are expected to reach 15% for Q3 2026, up two percentage points from the same period last year. That would mark the index’s second highest net profit margin since 2009, when FactSet began tracking the metric. Energy and tech, again, lead the expansion. Financials, meanwhile, faced the largest drag.
Analysts say some industries are better able than others to pass higher costs on to customers.
“Resilient demand, especially in manufacturing sectors, likely continued to support companies in passing through higher prices, similar as in Q2,” analysts at Deutsche Bank Research wrote in a recent note. “At the same time, consumer conditions remained weak, as retail sales declined further and confidence recovered only modestly.”
The earnings tailwind that’s been boosting stocks could be peaking, if current estimates hold. For the next three quarters, Wall Street sees declines in growth, with quarterly growth getting cut in half by the second quarter of 2027.
Even then, growth would be significantly above the 10-year average.
免責聲明:本專頁刊載的所有投資分析技巧,只可作參考用途。市場瞬息萬變,讀者在作出投資決定前理應審慎,並主動掌握市場最新狀況。若不幸招致任何損失,概與本刊及相關作者無關。而本集團旗下網站或社交平台的網誌內容及觀點,僅屬筆者個人意見,與新傳媒立場無關。本集團旗下網站對因上述人士張貼之資訊內容所帶來之損失或損害概不負責。